New Jersey Devils at Washington Capitals NHL Predictions
2026-10-17 • Capital One Arena
Washington Capitals 4 - 2 New Jersey Devils
🚨 Upset Win (68% underdog)
📊 Pre-Game Predictions
Win Probability
WSH: 32.4%
NJD: 67.6%
Expected Goals
WSH: 2.80
NJD: 3.91
Total Goals
Median: 6.7
Over 5.5: 68%
Over 6.5: 53%
🥅 Goalie Matchup
WSH
Logan Thompson - 15-11-3 | 0.913 SV% | 2.39 GAA
NJD
Jake Allen - 11-8-1 | 0.912 SV% | 2.52 GAA
| Stat | WSH | NJD |
|---|---|---|
| Season SV% | 0.913 | 0.912 |
| Last 5 SV% | — | — |
| SV% vs Opponent | — | — |
| GAA | 2.39 | 2.52 |
Last 5 / vs opponent shown when available in goalie stats. Confirmed goalie row used when available; otherwise current projected starter is shown.
Goalie Game Metrics
| Team | Goalie | SA | Saves | GA | SV% | xGA | HD Faced | GSAx |
|---|---|---|---|---|---|---|---|---|
| WSH | Logan Thompson | 31 | 29 | 2 | 93.5% | 4.00 | 3 | 2.00 |
| NJD | Jake Allen | 25 | 21 | 4 | 84.0% | 2.43 | 2 | -1.57 |
SA uses shots on goal plus goals. xGA, high-danger faced, and GSAx use modeled scoring attempts against. GSAx is xGA minus goals against.
Head-to-Head History
Model accuracy in this matchup: 35% • WSH at home vs NJD: 4-7
| Date | Score | Winner | Model Pick |
|---|---|---|---|
| 2026-10-17 | WSH 4 - 2 NJD | WSH | NJD |
| 2026-04-02 | NJD 7 - 3 WSH | NJD | NJD |
| 2026-03-20 | WSH 2 - 1 NJD | WSH | NJD |
| 2025-12-27 | NJD 3 - 4 WSH | WSH | WSH |
| 2025-11-15 | WSH 2 - 3 NJD | NJD | WSH |
Shot Quality by Period
| Period | Team | Shots | High Danger | xG |
|---|---|---|---|---|
| 1 | WSH | 10 | 1 | 0.78 |
| 1 | NJD | 14 | 2 | 1.11 |
| 2 | WSH | 16 | 1 | 1.17 |
| 2 | NJD | 9 | 0 | 0.65 |
| 3 | WSH | 7 | 0 | 0.48 |
| 3 | NJD | 33 | 1 | 2.24 |
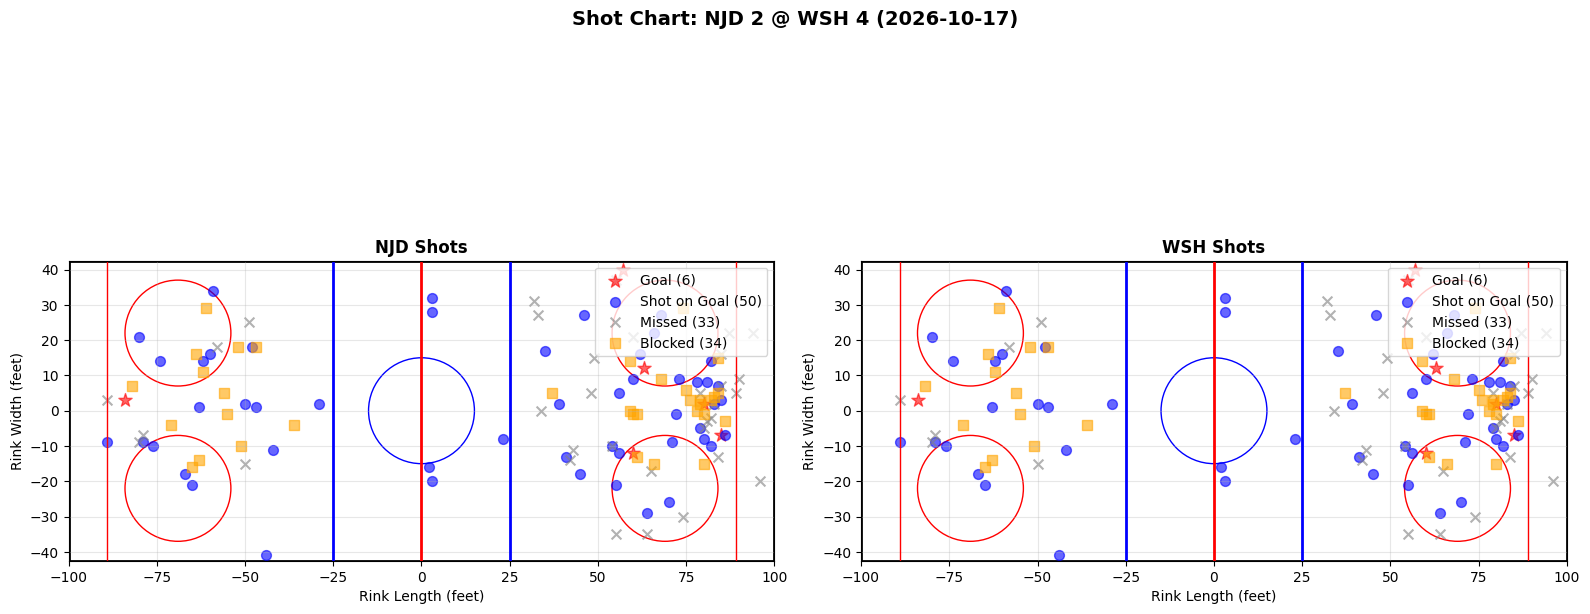
Shots are modeled attempts: shots on goal, goals, and missed shots. Blocked shots are excluded. High danger is xG >= 0.20.
🎯 Shot Chart
📈 Post-Game Analysis
Prediction Result
❌ Incorrect
Confidence: 67.6%
Total Goals
Actual: 6.0
Expected: 6.7
Score Breakdown
Washington Capitals 4 - 2 New Jersey Devils
Expected: 2.8 - 3.9
Get NHL forecasts in your inbox
Occasional emails with NHL forecasts, analysis, and model updates.